Data | AI | History | Facts

Idlestats.com - Data Visualzation
As a data visualization and analytics website, Idlestats.com offers a smarter way to explore and analyze your data. Whether you are a business owner, researcher, or data enthusiast, our website provides the knowledge you need to gain insights and make informed decisions.
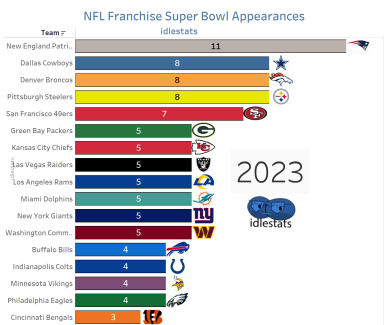
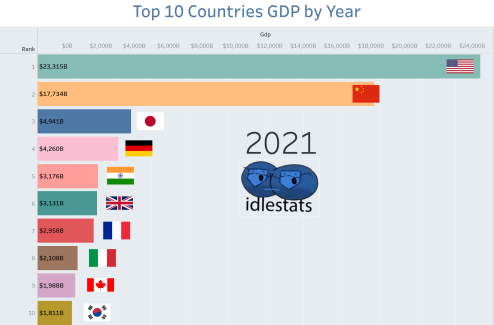
Our mission at idlestats is to make data more accessible and meaningful to everyone. We provide a variety of resources, including facts, history, statistics, and data visualization. Our data visualization team creates stunning charts, graphs, and infographics, making it easy to visualize trends and patterns in data. Our statistics cover a wide range of topics, including business, economics, health, education, and more. Our curated collection of history and facts offers fascinating insights into the events that have shaped our world.
As a website dedicated to data analysis and visualization, we understand the importance of search engine optimization (SEO). We use the latest SEO techniques to ensure that our website is easily discoverable by search engines. This allows us to reach a wider audience and provide even more value to our users.
In addition to providing data analysis and visualizations, we also offer expert advice and support. Our team of data experts is available to answer any questions you may have and provide guidance on how to get the most out of our tools and resources.
At IdleStats, we are committed to providing our users with the highest quality data analysis and visualization resources. Whether you are a data novice or an experienced analyst, our team has all the skills necessary to gain new insights and make informed decisions based on your data. Join our community today and discover a smarter way to explore and analyze your data.


